What Are The Top Energy Sources in California?

California’s nickname as the ‘Golden State’ traces back to the discovery of gold in 1848. Now, another Gold Rush age is underway on the West Coast – but instead of mountain streams, it takes place on residential rooftops. California is the nation’s leader in solar energy, already requiring panels to be installed on all new buildings from 2020 onwards. But will solar be enough to sustain the state’s ever-growing appetite for electricity? Let’s look at how California produces and consumes electricity in 2020.
Renewable vs. Non-renewable Sources in California
California is among the top states in the nation in electricity generation from renewable resources. Its current energy mix stands at 49.6% renewable energy generation, approximately 8% nuclear and only about 42% of energy comes from fossil fuels, such as crude oil and natural gas.
Environmental concerns have led the state on the West Coast to enact several state policies to reduce greenhouse gas (GHG) emissions. It set an ambitious goal to reduce emission to 1990 levels by 2020 and to 80% of 1990 levels by 2050 – and the 2020 milestone is already hit.
The California renewable portfolio standard (RPS) requires that 33% of retail electricity come from green resources by 2020, 60% by 2030, and 100% by 2045.
How Does California Produce Electricity?
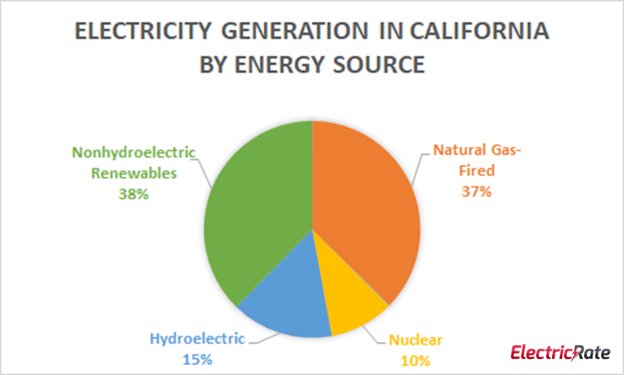
Natural Gas has been California’s chief energy source for producing electricity since 2001 but that has changed in 2017 when it got overtaken by renewable sources – solar and wind. This was partially thanks to California’s reputation as a sunny state and partially due to aggressive state policies promoting green electricity.
As a result, solar and wind now account for nearly 38% of the state electricity generation, followed closely by natural gas with 37%. Interestingly, California also has the second-largest conventional hydroelectric generating capacity in the U.S. after Washington state and is among the nation’s top four hydropower producers.
However, the amount of hydroelectric power produced in California fluctuates, mainly as a result of drought seasons (notable example includes the dry year 2015 when hydropower supplied only about 7% of California’s net generation). Nowadays, hydropower contributes approximately 15% to California electricity generation tally.
Other energy sources are negligible. The state’s nuclear capacity and generation have been on the decline ever since the government embraced solar (it now contributes only about 10% to generated electricity) and the share of petroleum and coal in the energy mix is almost too small to mention.
Solar Energy in California
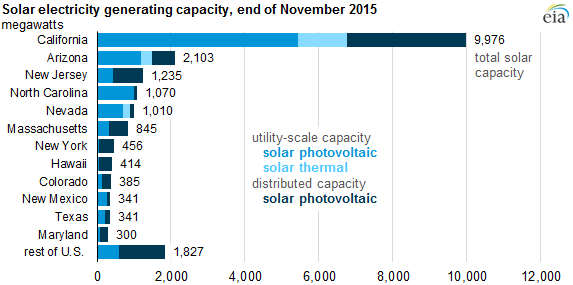
The state’s southeastern deserts provide the ideal location for solar thermal facilities and the largest solar plants, but residential PV panels are located across the whole state.
California produces more than two-fifths of U.S. total solar PV electricity and is home to more than half of the total 20,000 megawatts (MW) of solar generating capacity in the nation (approximately 12,000 MWs in 2018).
The state policymakers encourage residents to continue installing solar panels on their roofs through various incentives, grants, and rebates collectively known as the California Solar Initiative (CSI).
Solar customers are eligible for the Net Energy Metering Program (NEM), which provides financial credit for customer-generated solar power that is fed back to the electric grid. Additionally, the 2019 building energy efficiency standards in California require all new homes built in 2020 and later to come with solar PV systems.
Where The Sun Don’t Shine
One unwanted side effect of the increased penetration of Californian solar power was a series of rolling blackouts that affected hundreds of thousands of Californians in 2019. How is that possible?
Simply put, the U.S. electrical grid was built a few decades ago with the underlying assumption that power will flow through it in one direction – from large generation facilities through transmission and distribution lines all the way to the end customer.
However, as more residential PVs plug into the grid, especially at the same time when the sun shines the most on the Golden State roofs, it creates sharp spikes in the amount of electricity flowing through the lines. Simultaneously, when the sun goes down or hides behind the cloud, the solar electricity tap is turned off, often coinciding with the time of day when people come home from work and start their AC units and other energy-consuming devices.
The created instability is worrying the state’s regulators who have already called for better grid management and increased energy storage capacity. One promising project is the Gateway Energy Storage underway in San Diego. From September 2020, it can store and dispatch 230 megawatts for one hour, making it the largest battery installation in the world. Sorry, Elon!
How Does California Consume Electricity?
California is the most populous state in the U.S., has the largest economy, and is home to the nation’s most prominent technology hub – Silicon Valley, where thousands of computers and laptops are plugged in to receive a never-ending stream of electricity.
You’d be justified to assume that California’s electricity consumption would be enormous but in fact, the state has one of the lowest per capita electricity consumption levels in the United States.
What’s California’s secret? The Golden State has a long history of promoting energy efficiency policies, including investments in new technologies, utility programs to incentivize customers to use less electricity, and energy efficiency standards for new buildings and appliances. One research indicates that these continuous efforts have helped residents to save more than $65 billion since the 1970s.
Electricity Consumption Per Capita
So how does California compare to other U.S. states? Out of the 10 states with the lowest electricity consumption per capita, California ranks fourth with approximately 200 million British thermal units, right above Hawaii, New York, and Rhode Island.
| Ranking | State | Energy Consumed per Capita (million BTUs) |
|---|---|---|
| 1 | Rhode Island | 174 |
| 2 | New York | 188 |
| 3 | Hawaii | 199 |
| 4 | California | 200 |
| 5 | Florida | 201 |
| 6 | Connecticut | 203 |
| 7 | Massachusetts | 208 |
| 8 | Arizona | 209 |
| 9 | Vermont | 216 |
| 10 | Maryland | 218 |
Electricity Consumption By Sector in California

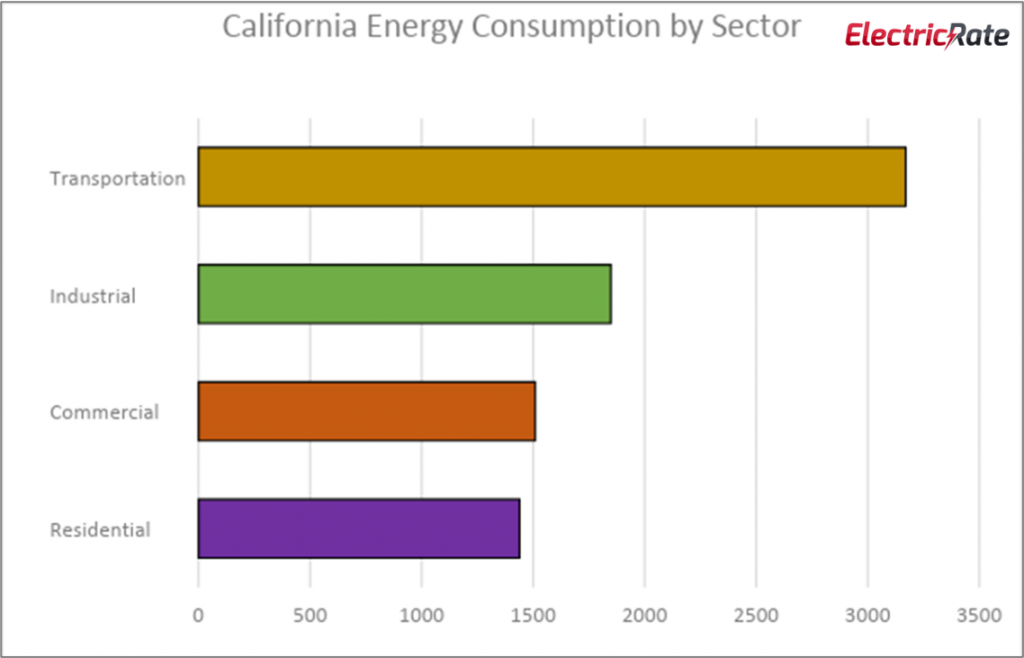
More than 1,000 miles long and 500 miles wide, California is the third-largest state by land area. As a result, transportation by far dominates other sectors when it comes to energy consumption.
More motor vehicles are registered in California than in any other state and more vehicle miles are traveled in California than in any other state. Because commutes are long across the stretched state, California drivers also put on more miles than their counterparts elsewhere in the U.S.
The second biggest sector in terms of energy consumption is the industrial sector (approximately one fourth), with commercial and residential sectors in the tail.
Residential Electricity Prices in California
It’s just as well that Californians try not to use too much electricity at homes – because it comes at a steep cost. The average residential electricity rate in the Golden State is 19.17 cents per kilowatt-hour, well above the national average.
Only between 2016 and 2017, California’s electricity prices rose three times more than they did in the rest of the United States. What makes Californian electricity so expensive?
Californian utility companies have long enjoyed a favorable relationship with the state regulators, which have allowed extensive investments in the building of new power plants and maintaining transmission lines. These capital costs are of course passed onto the customers in a form of rate hikes.
These newly constructed power plants bring the investor-owned utility companies a rate of return of about 10.5%, regardless of whether the plant is needed or not. As a result, in 2020, California produces at least 21% more electricity than it needs and you, the electricity customer, are footing the bill.
Energy Deregulation in California
Do Californians have an energy choice to avoid the steep electric rates and blown-out bills? Yes and no. Following the California Energy Crisis of 2000 and 2001, the state has largely suspended its deregulated energy policy and it’s taken a long time a long time since to reinstate it.
Currently, the choice of a competitive supplier is only available to natural gas residential customers, even though awareness is slim. Electricity deregulation has large limitations and is currently open only to businesses.
FAQs
Where does electricity in California come from?
Natural Gas was recently (2017) overtaken by renewables as California’s chief energy source. Solar and wind now account for nearly 38% of the state electricity generation, followed closely by natural gas with 37%. Interestingly, California also has the second-largest conventional hydroelectric generating capacity in the U.S. after Washington state and is among the nation’s top four hydropower producers. California produces an additional 9% of electricity in nuclear power stations that are being slowly phased out. The share of petroleum and coal in the energy mix is negligible.
How does my state produce electricity?
The energy mix in each U.S. state is as unique and diverse as the individual states themselves and depends on multiple factors, including the availability of natural resources in the state. For example, 26% of the coal produced in the United States came from the Appalachian coal region, including Wyoming, West Virginia, Pennsylvania, Kentucky, and Illinois. On the other hand, warm sunny states, such as California, Nevada, or Hawaii have higher portions of solar-generated electricity. To see the energy mix in your state or to play with our interactive map of energy sources in the U.S. states, check out our interactive energy sources map.
What Is the Difference Between Renewable and Non-renewable Energy Sources?
The difference between renewable and non-renewable sources lies in the limits of their supply. Non-renewable energy comes from resources, such as coal, petroleum, natural gas, propane, and uranium that are not replenished on a regular basis as their supply on this earth is limited. Renewable energy comes from sources that replenish naturally day after day, such as sun, wind, or water. They are also considered to be greener than fossil fuels because producing them does not emit harmful CO2 gases.
Updated on