What Energy Sources Does Your State Use?
The United States produces and consumes many different types of energy sources, which can be grouped into general categories such as renewable and nonrenewable or primary and secondary. But what do those terms mean and how does that impact your electric bill or your carbon footprint?
Interactive Map for Energy Sources by State
Renewable vs Non-Renewable Energy Sources
The first classification that we will talk about is renewable versus non-renewable energy. As the name suggests, the difference in the two types of energy sources will be related to the limited supply.
Non-renewable energy comes from resources that are not replenished on a regular basis and therefore their supply on this earth is limited. Petroleum, for example, was formed millions of years ago from the remains of ancient sea plants and animals. It’s not possible to make more petroleum, at least not in a short period of time.
What are some non-renewable energy sources? You probably heard about coal, petroleum, natural gas, propane, and uranium. In the U.S., they are used to power our homes, move our cars, and for manufacturing various daily use products. They also account for the majority of the world’s greenhouse gas emissions.
Renewable energy comes from sources that replenish naturally day after day. The sun continues to shine, the wind continues to blow and the water continues to run – and with the use of technology, we can continue to harvest energy from these sources indefinitely at no additional cost. Biomass, geothermal energy, hydropower, solar energy, and wind energy are all considered to be renewable energies.
Unlike coal or petroleum, generating energy from renewable sources – often referred to as green energy – doesn’t result in harmful greenhouse emissions being produced.
But it’s not just emissions we should be concerned about. According to research, electricity-generating facilities are also the single biggest consumers of fresh-water in the U.S. Why should that concern us? You might be aware that the world is currently in a water crisis, with several major cities across the globe are already counting the days towards the “Day Zero,” when they’ll officially run out of water.
Which energy resources are gulping down our water?
Let’s look at the water consumption in gallons per MWh produced by energy source:
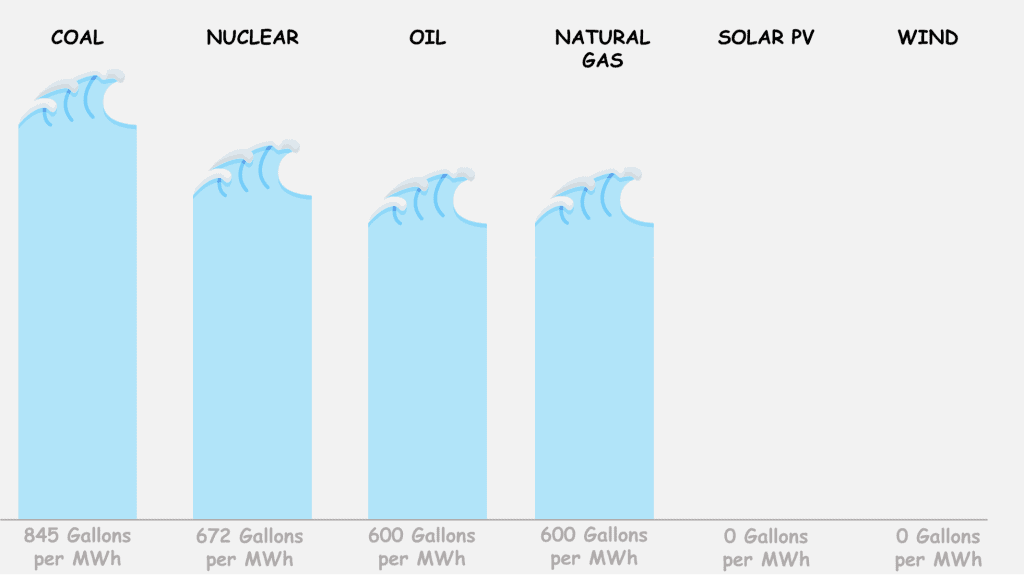
For an example of the impact of extensive water consumption resulting from overreliance on non-renewable sources, you need to go no further than Texas. The Lone Star State has been battling a water deficit for years, while according to research, 100 percent of the water deficit projected for five counties in 2020 can be met by cutting oil and gas water use by half.
Primary vs Secondary Energy Sources
The other energy source distinction we can make is between primary and secondary sources. Primary energy sources are unconverted fuels, meaning that they continue in the form that they were found in nature, before being converted into secondary or tertiary forms of energy.
We are, of course, talking about petroleum, natural gas, coal, biomass, flowing water, wind, and solar radiation.
Secondary sources of energy—converted from primary energy sources—are used to deliver energy in an easily usable form. For example, petrol is derived from the treatment of crude oil, and electricity is obtained from either coil or in the more environmentally-friendly case, solar radiation.
How Does The U.S. Produce Electricity?
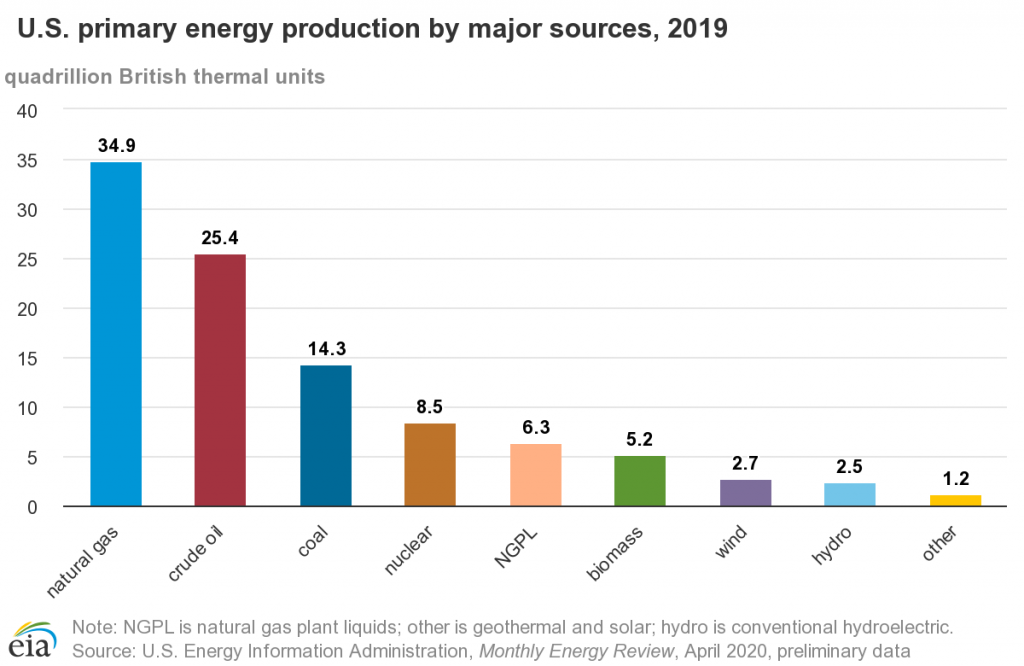
The United States produces many different types and sources of energy to meet the country’s demand for electricity and other fuels.
During the twentieth century and for the first sixteen years of the twenty-first century, coal continued to be the chief energy source for producing electricity. But then in 2017, it was overtaken by natural gas, which now powers 34% of the country’s electricity.
Let’s look at the breakdown of the U.S. electricity production by energy source:
What About the Other Energy Sources?
 | Nuclear - Nuclear power isn't considered renewable energy, given that it’s generated by processing uranium, a finite though abundant resource. l The USA has 98 operating nuclear power reactors in 30 states, accounting for about 20% of the total electricity generated. Even though nuclear reactors do not emit any of the greenhouse gases, there are definitely downsides, such as the possibility of nuclear explosion (rare but devastating threat) and long-lived nuclear waste. |
 | Hydro - In the U.S. alone, it is responsible for 6.6% of utility-scale energy generation and the second-highest renewable energy generation (only recently overtaken by electricity generated from wind). The biggest U.S. adopters are Washington, Oregon, Vermont, and Idaho, getting between 56 - 68 percent of their electricity from hydroelectric plants. Yet, despite generally being considered a renewable source, there’s controversy around hydropower, resulting in many states being hesitant to count it towards their clean energy mandates. Why? You’ll have to read our blog Is Hydropower Renewable or Nonrenewable to find out. |
 | Wind - Wind is the fastest-growing power source, with some 999 wind-powered electric plants in the United States with an additional 44 GW of wind power generation projects under construction. The energy produced from wind is clean, renewable, and comparably very cheap to produce. Its only drawback is the intermittency of generated electricity, especially on a windless day. |
 | Solar - Since 2008, U.S. installations have grown to an estimated 62.5 gigawatts (GW), or enough to power 12 million average American homes. Of course, solar energy is generated predominantly in the Southwest, where the sun shines the most, such as California, Arizona, or Hawaii. The payback period of residential solar panels is getting shorter as more households invest in generating their own electricity. But Are Your Solar Panels Facing The Wrong Direction? Read our guide to find out how to maximize the savings from your panels. |
What Are the Different Energies Measured in?
Crude oil is measured in barrels, natural gas is measured in therms (or cubic meters) and electricity (solar, wind, coal, or hydro) is measured in watts. Interested in discovering more energy units or finding out what is a terawatt? Check out our guide.
How Does Your State Make Electricity?
Every U.S. state will have a different mix of energy sources used to produce electricity. This energy mix depends on multiple factors, including the availability of natural resources in the state.
For example, 26% of the coal produced in the United States came from the Appalachian coal region, including Wyoming, West Virginia, Pennsylvania, Kentucky, and Illinois. On the other hand, warm sunny states, such as California, Nevada, or Hawaii will have higher portions of solar-generated electricity.
Let’s compare the electricity mix by energy source in each U.S. state:
| State | % Fossil Fuels* | % Renewable Energy sources** | Nuclear Electric Power | Total electricity (‘000s MWhs) |
|---|---|---|---|---|
| Alabama | 57.9 | 10.6 | 31.4 | 10,627 |
| Alaska | 74.9 | 25 | 0 | 530 |
| Arizona | 61.4 | 10.6 | 28.1 | 7,117 |
| Arkansas | 71 | 7 | 22 | 4,070 |
| California | 42.5 | 49.6 | 7.9 | 14,823 |
| Colorado | 75.5 | 24.4 | 0 | 4,411 |
| Connecticut | 53.1 | 5 | 41.7 | 3,454 |
| Delaware | 97.8 | 2.1 | 0 | 266 |
| Florida | 83.5 | 4.8 | 11.8 | 7,697 |
| Georgia | 65.7 | 8 | 26.3 | 746 |
| Hawaii | 82.6 | 17.4 | 0 | 1,443 |
| Idaho | 21.2 | 78.7 | 0 | 13,119 |
| Illinois | 37.5 | 8.1 | 54.4 | 6,947 |
| Indiana | 92.7 | 7.2 | 0 | 4,238 |
| Iowa | 48.2 | 43.5 | 8.3 | 4,043 |
| Kansas | 40.5 | 41.5 | 17.8 | 4,161 |
| Kentucky | 93.6 | 6.4 | 0 | 8,626 |
| Louisiana | 82.4 | 3.7 | 13.8 | 846 |
| Maine | 17 | 83 | 0 | 2,837 |
| Maryland | 52 | 10.2 | 37.8 | 989 |
| Massachusetts | 72.2 | 18 | 9.8 | 8,717 |
| Michigan | 63.9 | 7.8 | 28.2 | 4,301 |
| Minnesota | 49.5 | 26.2 | 24.4 | 4,297 |
| Mississippi | 80.9 | 2.6 | 16.5 | 5,219 |
| Missouri | 82.5 | 5.4 | 12 | 1,972 |
| Montana | 56 | 44.1 | 0 | 2,998 |
| Nebraska | 58.1 | 23.3 | 18.7 | 3,081 |
| Nevada | 71.7 | 28.3 | 0 | 1,388 |
| New Hampshire | 22.1 | 17.3 | 60.8 | 4,472 |
| New Jersey | 59 | 3.6 | 37.4 | 2,556 |
| New Mexico | 76 | 24 | 0 | 10,461 |
| New York | 38 | 28.1 | 33.9 | 9,010 |
| North Carolina | 55.2 | 12.9 | 31.8 | 3,513 |
| North Dakota | 65.2 | 34.8 | 0 | 8,671 |
| Ohio | 83.1 | 2.6 | 14.2 | 6,251 |
| Oklahoma | 62.9 | 37.1 | 0 | 5,851 |
| Oregon | 38 | 62 | 0 | 18,519 |
| Pennsylvania | 59.7 | 4.3 | 36 | 601 |
| Rhode Island | 93.4 | 6.5 | 0 | 8,181 |
| South Carolina | 39 | 5.1 | 55.8 | 1,229 |
| South Dakota | 31.5 | 68.5 | 0 | 6,482 |
| Tennessee | 43.4 | 12.8 | 43.7 | 35,075 |
| Texas | 72.5 | 19 | 8.6 | 2,496 |
| Utah | 88.6 | 11.4 | 0 | 210 |
| Vermont | 0.2 | 99.9 | 0 | 8,825 |
| Virginia | 64 | 5.9 | 30.3 | 8,768 |
| Washington | 20.1 | 71.5 | 8.4 | 3,823 |
| West Virginia | 94.6 | 5.5 | 0 | 4,958 |
| Wisconsin | 75.9 | 8.1 | 16 | 3,406 |
| Wyoming | 87.6 | 12.4 | 0 | 10,627 |
*Fossil fuels – Coal, Petroleum and Natural Gas, **Renewable sources – Hydroelectric, Geothermal, Biofuels, Solar PV and Wind
You can also play around with this cool visualization of energy source mix by state, compiled by the Washington Post.
It’s important to note that some U.S. states will be energy exporters while others will be energy importers. Being an energy exporter means that the state or the country is able to produce more energy that it consumes, meaning that it could export some of it to other countries or states.
In 2019, the United States has become a net total energy exporter for the first time since 1952.
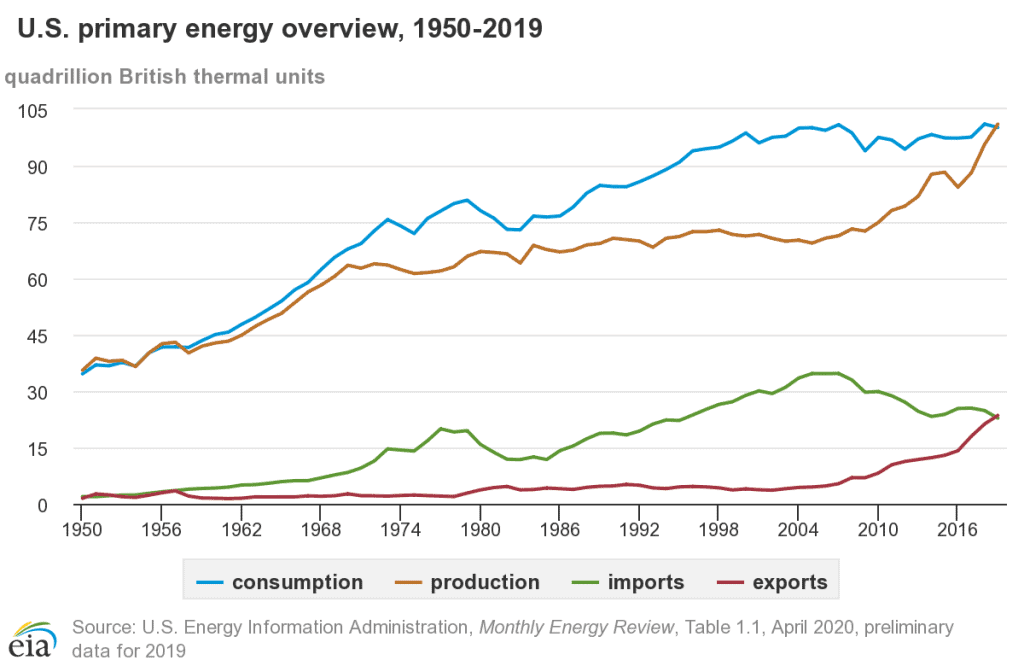
Which states consume more electricity than they produce? According to the EIA, California is the largest net energy importer, receiving more than 80 million megawatt-hours (MWh) annually from other states. The reason is a combination of high electricity demand and California’s policy of renewable energy promotion as opposed to fossil-fuel generation, putting the Golden State supply in jeopardy when the sun isn’t out.
Another example of net energy importer is Hawaii, where reliance on oil imports contributes to the fact that Hawaii has the highest average electricity rates by state in the U.S. It’s hard to enjoy sipping from a coconut shell on the beach when your electric bill consumes a big chunk of your monthly income.
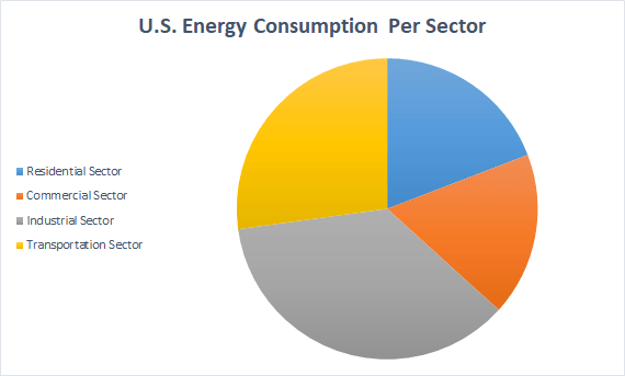
How Does The U.S. Consume Electricity?
The energy in the U.S. is consumed primarily by four sectors – industrial, transport, residential, and commercial. All the electricity that you use at home by keeping your lights on, cooking dinner, watching TV, and leaving your chargers plugged in overnight forms approximately 20% of the total energy consumed in the country.
What about individual states? Of course, the total electricity consumed by the state is not a great way to understand what’s going on. For example, Texas residents consumed a whopping 13 quadrillion BTUs in 2015 while Wyoming only used 512 trillion Btu, or 25-times less. Of course, the population of Texas is much, much bigger.
A better metric to consider is energy consumption per capita or the energy consumed on average per person in the state.
| Ranking | State | Total Energy Consumed per Capita (million BTUs) |
|---|---|---|
| 1 | Louisiana | 960 |
| 2 | Wyoming | 885 |
| 3 | North Dakota | 836 |
| 4 | Alaska | 822 |
| 5 | Iowa | 496 |
| 6 | Texas | 472 |
| 7 | Nebraska | 457 |
| 8 | South Dakota | 441 |
| 9 | Oklahoma | 418 |
| 10 | West Virginia | 416 |
| 11 | Indiana | 406 |
| 12 | Montana | 399 |
| 13 | Mississippi | 394 |
| 14 | Alabama | 390 |
| 15 | Kentucky | 372 |
| 16 | Kansas | 369 |
| 17 | Arkansas | 352 |
| 18 | Minnesota | 329 |
| 19 | South Carolina | 327 |
| 20 | New Mexico | 327 |
| 21 | Tennessee | 323 |
| 22 | Idaho | 322 |
| 23 | Ohio | 312 |
| 24 | Wisconsin | 312 |
| 25 | Illinois | 303 |
| 26 | Pennsylvania | 298 |
| 27 | Maine | 294 |
| 28 | Missouri | 283 |
| 29 | Washington | 282 |
| 30 | Delaware | 282 |
| 31 | Michigan | 278 |
| 32 | Virginia | 272 |
| 33 | Georgia | 269 |
| 34 | Utah | 267 |
| 35 | Colorado | 261 |
| 36 | Oregon | 249 |
| 37 | North Carolina | 244 |
| 38 | District of Columbia | 241 |
| 39 | New Jersey | 240 |
| 40 | Nevada | 238 |
| 41 | New Hampshire | 235 |
| 42 | Maryland | 218 |
| 43 | Vermont | 216 |
| 44 | Arizona | 209 |
| 45 | Massachusetts | 208 |
| 46 | Connecticut | 203 |
| 47 | Florida | 201 |
| 48 | California | 200 |
| 49 | Hawaii | 199 |
| 50 | New York | 188 |
| 51 | Rhode Island | 174 |
Remember Hawaii where residential electricity is the most expensive of all states? Luckily, its energy consumption per capita is one of the lowest, which means that although residents pay a lot more for a kilowatt-hour of electricity, their electric bills will be kept relatively stable since Hawaiians try to use as little electricity as possible.
Other states with high electricity rates have implemented other solutions to keep those utility bills. They opened up the energy marketplace so that customers can shop around and switch electric suppliers for a better price. Not sure, how does electricity deregulation work, and can you take advantage of it in your state? Read our guide to find out.
We hope that this article has shed some light on the different types of energy sources that are produced and consumed in each U.S. state. Whether you live in coal-heavy Pennsylvania or a solar-friendly California, don’t forget to enter your zip code to find out, if you can’t find a better electric rate to lock-in and reduce your utility bills.
FAQs
Below are answers to some of the questions you might have about the energy sources in the U.S.
Where Does My Electricity Come From?
The United States predominately consumes electricity generated from fossil fuels, such as coal, and natural gas. If your electricity is supplied from your local utility company, this is the type of energy that powers your house. However, in the deregulated U.S. states, the customers are able to select the electric plan that best fits their needs from a retail energy provider (REP). REPs often offer partially or 100% green electricity plans for competitive prices, making the green energy choice more attractive.
How Does the U.S. Produce Electricity?
The United States produces many different types and sources of energy to meet the country’s demand for electricity and other fuels. In 2017, natural gas overtook coal as the biggest energy source, contributing to 34% of the country’s electricity production. It is followed by crude oil (25%) coal (14%), nuclear (8.5%) and renewable energies (16.5%).
What Is the Difference Between Renewable and Non-renewable Energy Sources?
The difference between renewable and non-renewable sources lies in the limits of their supply. Non-renewable energy comes from resources, such as coal, petroleum, natural gas, propane, and uranium that are not replenished on a regular basis as their supply on this earth is limited. Renewable energy comes from sources that replenish naturally day after day, such as sun, wind, or water. They are also considered to be greener than fossil fuels because producing them does not emit harmful CO2 gases.
Updated on