Is Your State The Biggest CO2 Producer?
Carbon emissions. We’ve been hearing those words for the past decade or so, usually in connection with climate change and its impact on the planet. What many don’t realize is that carbon emissions have been occurring in nature since the beginning of time.
Carbon dioxide (CO2), the gas associated with carbon emissions, gets into the atmosphere because of natural processes. For example, animals emit carbon dioxide through breathing. Decomposing organic matter, such as dead plants and wildlife, also releases this greenhouse gas into the air. So do volcanic eruptions.
However, nature keeps things in balance. For example, plants absorb the released carbon dioxide through photosynthesis. Certain areas of the ocean do the same thing. So without human activity or intervention, greenhouse gas emissions won’t be a cause for concern.
The problem with greenhouse gases (GHG) began when industrialization started increasing the concentration of carbon dioxide in the atmosphere. More so than what nature can keep in check. Since the advent of the Industrial Revolution, the volume of CO2 in the air has increased by over 50%.
According to the U.S. Energy Information Administration, most of the carbon dioxide emissions in the country come from the combustion of fossil fuels, such as oil, coal, and natural gas, for energy-related purposes like electricity.
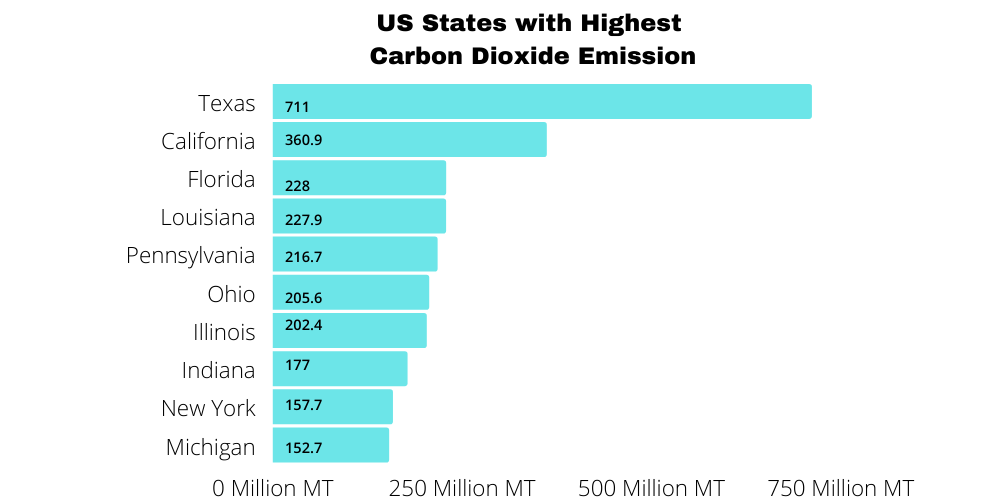
Carbon Emissions by State – The Highest
Because the situations in states across the country vary, the level of carbon dioxide each area discharges also differs.
The following lists the highest carbon emissions by states in the U.S.
- Texas- 711 million metric tons
- California- 360.9 million metric tons
- Florida- 228 million metric tons
- Louisiana-227.9 million metric tons
- Pennsylvania-216.7 million metric tons
- Ohio- 205.6 million metric tons
- Illinois- 202.4 million metric tons
- Indiana- 177 million metric tons
- New York- 157.7 million metric tons
- Michigan- 152.7 million metric tons
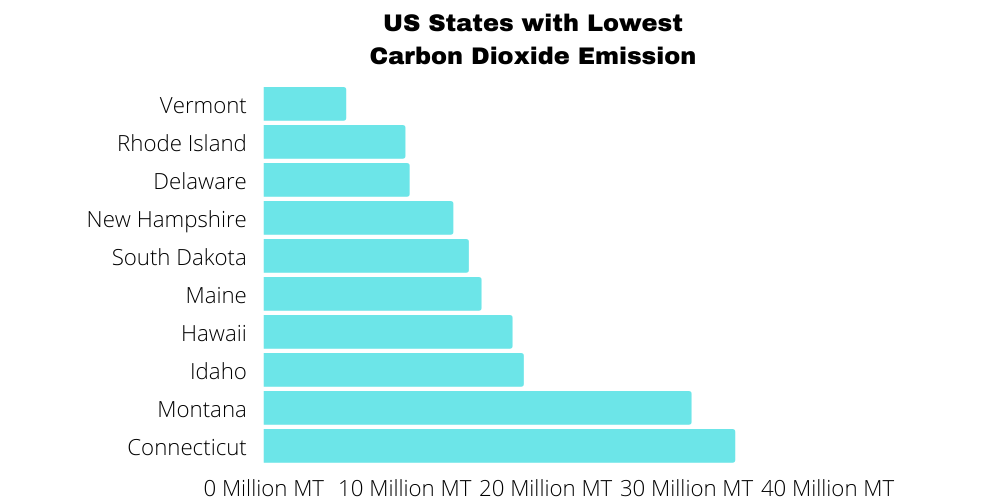
Carbon Emissions by State – The least
It’s comforting to note that the country’s carbon dioxide emissions had been dropping even before the Covid-19 pandemic. It peaked at 6.131 million metric tons in 2007 and had declined to 5.255 million metric tons in 2019. Several states saw marked emission reductions, and currently, those that have the lowest levels are:
- Vermont- 5.8 million metric tons
- Rhode Island- 10 million metric tons
- Delaware- 10.3 million metric tons
- New Hampshire- 13.4 million metric tons
- South Dakota- 14.5 million metric tons
- Maine- 15.4 million metric tons
- Hawaii- 17.6 million metric tons
- Idaho- 18.4 million metric tons
- Montana- 30.3 million metric tons
- Connecticut- 33.4 million metric tons
Highest Carbon Dioxide Emissions Per Capita
In addition to carbon emissions by state, we also have to consider carbon dioxide emissions per capita (or what each person in the area produces on average), these are the states that rank high on the list.
Wyoming
- Annual per capita carbon dioxide emissions: 105.4 metric tons
- Fuel source producing the most carbon dioxide emissions: coal
- Population density: 6.0 people per square mile
- Area where the majority of the greenhouse gas emissions come from: electricity generation
North Dakota
- Annual CO2 emissions per capita: 74.9 metric tons
- Fuel source producing the most carbon dioxide discharges: coal
- Population density: 11.0 people per square mile
- Area where most of the CO2 emissions come from: electric power sector
West Virginia
- Annual per capita carbon dioxide emissions: 50.3 metric tons
- Fuel source that discharges the most CO2: coal
- Population density: 74.6 people per square mile
- Area where the majority of the carbon dioxide emissions come from: electric power sector
Louisiana
- Annual per capita carbon dioxide emissions: 48.8 metric tons
- Fuel source producing the most emissions of carbon dioxide: petroleum
- Population density: 107.6 people per square mile
- Area with the most CO2 emissions: industrial activities
Alaska
- Yearly per capita CO2 discharges: 46.3 metric tons
- Fuel source that emits the most carbon dioxide: natural gas
- Population density: 1.3 people per square mile
- Area with the most carbon emissions: industrial sector
Lowest Carbon Dioxide Emissions Per Capita
Don’t be surprised if some of those who made it to the list of states with the highest emissions are also mentioned here. It just means that taking each of the state’s population density into consideration altered the figures. The results show that the said state produced lower carbon dioxide emissions in proportion to the number of people who live in the area.
The following are those that have the least CO2 discharges per capita.
New York
- Per capita annual carbon dioxide emissions: 8.1 metric tons
- Fuel source with the most carbon dioxide emissions: petroleum
- Population density: 412.8 people per square mile
- Area with the most CO2 emissions: transportation
Maryland
- Annual per capita CO2 emissions: 8.6 metric tons
- Fuel source producing the most carbon dioxide emissions: petroleum
- Population density: 622.8 people per square mile
- Area with the most carbon emissions: transportation sector
California
- Yearly per capita emissions of carbon dioxide: 9.2 metric tons
- Fuel source producing the most carbon dioxide emissions: Petroleum
- Population density: 253.6 people per square mile
- Area with the most emissions of CO2: transportation
Vermont
- Annual emissions of carbon dioxide per capita: 9.3 metric tons
- Fuel source that discharges the most CO2: petroleum
- Population density: 67.7 people per square mile
- Area where majority of the greenhouse gas emissions come from: transportation
Oregon
- Per capita emissions of carbon dioxide: 9.3 metric tons
- Fuel source that produces the majority of carbon dioxide emissions: petroleum
- Population density: 43.9 people per square mile
- Area with the most emissions of CO2: transportation
What Are The Main Sources Of CO2 Emissions In The US?
CO2 emissions come from natural and human sources. Examples of natural sources are decomposing vegetation and other matters, erupting volcanoes, and naturally occurring wildfires. Meanwhile, human sources include burning fossil fuels for energy-related activities, deforestation, and cement production.
Between the two sources, human activities drive the concentration of carbon dioxide in the atmosphere higher than natural ones. In fact, since the Industrial Revolution, the emission levels have been climbing steadily and have now crossed into the danger zone.
According to the Energy Information Administration, the carbon dioxide that goes into the air comes primarily from the combustion of traditional fuel sources.
Energy-related activities from these following sectors lead to carbon discharges into the atmosphere.
Transportation
For over 40 years, power plants have been the largest source of GHG in the U.S. However, based on data from the Energy Information Administration, transportation had toppled power generation from the top spot.
The emissions from millions of vehicles on the road have now made the transportation sector the largest source of climate-changing CO2 discharges in the country. This sector accounted for 29% of all emitted greenhouse gases in 2019.
Modern forms of transport such as trucks, cars, planes, and trains typically use petroleum-based fuel like diesel or gasoline. Fuel combustion produces energy that powers the vehicles, but the process also releases CO2. Burning, or combusting, one gallon of gas generates around 20 pounds of CO2. On average, each vehicle on the road creates roughly about 6-9 tons of carbon dioxide a year.
Three-quarters of transport emissions come from road travel. Passenger vehicles, such as cars and buses, yielded 45.1% of the discharges, while trucks carrying freight contributed 29.4% of the emissions.
Electricity generation
Without electric power, the wheels of the industries that drive the economy will stop turning. That’s why electricity generation remains a top priority in the country.
In 2019, the U.S. generated 4.13 trillion kilowatt-hours (kWh), which resulted in 1.72 billion metric tons of carbon emissions and accounted for 25% of the country’s emissions of CO2. This translates to around 0.92 pounds of carbon dioxide emissions per kWh.
Burning traditional sources of energy such as coal, natural gas, and oil to generate heat that drives the steam turbines to produce electricity is the reason behind the emissions of CO2.
Power plants that relied on fossil fuels produced around 62% of the total generated electricity of the U.S., but they were responsible for 99% of the country’s electricity-related carbon dioxide releases in 2019.
The electricity sector relies heavily on coal, which, unfortunately, is the most carbon-intensive fossil fuel. Burning a ton of coal releases around 2.5 tons of CO2 into the atmosphere, giving it a high carbon intensity score.
Carbon intensity refers to how many grams of CO2 are released into the air to produce one kilowatt-hour of electricity.
Industrial activity
Industrial activities include construction, mining, agriculture, and manufacturing. Of the four, manufacturing is the most extensive as it covers different categories like paper, food, petroleum refineries, chemicals, and metal/mineral products production.
Industrial processes yield large amounts of CO2 because most manufacturing facilities burn fossil fuels for energy-related needs during the various stages of production. Add to that, some activities in this sector lead to the destruction of standing forests that decimates the number of trees that absorb CO2 and other gases that are detrimental to the environment.
Of the total GHG that went into the earth’s atmosphere in 2019, 23% came from the industrial sector.
Residential and commercial buildings
Emissions from buildings used for residential/commercial purposes comprised around 13% of the country’s total carbon discharges in 2019.
The discharges occur in the following ways:
- Through day-to-day energy use: Cooling, heating, and lighting the buildings require electric power. Electricity generation primarily uses traditional energy sources which produce large amounts of GHG.
- Through the construction process: Manufacturing the building materials, transporting those materials to the site, and erecting the structure typically use various energy sources that emit CO2 and other gases.
The emissions of greenhouse gases from residential and commercial buildings have remained relatively constant since the 1990s, staying at around 750 million metric ton
Agriculture
Activities in the agricultural sector inevitably produce harmful gases, and CO2 comprises almost 80% of those gases. In 2019, 10% of the carbon discharges that went into the atmosphere came from agricultural activities.
The sources of agriculture-related emissions of GHG include energy the following:
- Energy use in farm machinery, vehicles, and structures for crop cultivation and livestock production
- Use of fuel in the transport and distribution of agricultural products
- Waste produced by the farming process
- Use of organic and inorganic fertilizers
- Tilling and soil compaction
Over the last 26 years, emissions from agriculture have risen by roughly around 80 million metric tons.
Land Use
Changes in land use result in significant releases of CO2 into the atmosphere. These emissions occur when the natural environment is modified for human use, such as when wildlands are adapted for agricultural, commercial, industrial, or residential purposes.
Deforestation, or the clearing of standing forests, is responsible for the majority of the emissions. Large tracts of forested areas have been converted into farms or pastures or turned into residential zones, which led to increasing emissions of CO2.
Cutting trees cause discharges of GHG into the air because of the following reasons:
- Burning and the decomposition process releases CO2: When trees are cleared, they’re either burned or left to rot. Burning and the decomposition process produces CO2.
- Deforestation reduces the number of trees that absorb carbon emissions: Trees serve as carbon sinks. That is, they absorb CO2 from the air through photosynthesis. Thus, clearing large tracts of standing forests hampers nature’s ability to significantly lower the amount of CO2 in the environment.
- Deforestation alters the way carbon is stored in the soil: Carbon is stored in the soil due to decaying material. Human activities, such as cutting trees, disturb the soil and lead to the release of CO2 contained in it.
- Removing forest cover can lead to erosion: Soil erosion and the resulting nutrient leech further reduces the area’s ability to absorb harmful emissions of CO2.
Twelve percent of the greenhouse gas emissions in 2019 came from the changes in land use.
Emissions and Trends
Emissions of greenhouse gases in the country have increased by 2% since 1990. The levels fluctuate from year to year due to fuel prices, changes in the economy, and other factors. In comparison to 2018 levels, the United States’ emissions of greenhouse gases fell in 2019. The fall was primarily due to a reduction in CO2 emissions from fossil fuel combustion. The decrease in CO2 discharges came from several factors, including a reduction in the number of people using fossil fuels and a sustained shift from coal to other energy sources with a lower carbon intensity.
The Reason Behind The Disparity of Carbon Emissions Between States
The U.S. Energy Information Administration has determined that several factors affect the level of per capita and total carbon emissions in various states.
These factors are:
- Size of the state: Energy is needed to power residential, commercial and industrial activities. Although it’s not usually the case, states with larger land areas also tend to have a larger population. That means more people need electric power for their homes and businesses, and electricity generation produces gases that trap heat in the earth’s atmosphere. So the higher the electricity requirement of the area, the higher the emission levels.
- Available fuels in the area: Renewable energy sources are cleaner than traditional ones. That’s why states that incorporate more renewable energy sources into their power mix will naturally have lower emissions of CO2 and other gases that contribute to global warming vis-a-vis those that rely purely on traditional power sources.
- Types of businesses in the locality: Consumption of energy for industrial and commercial activities eject significant amounts of harmful gases. So the more robust the manufacturing and business sectors are, the more GHG go into the air.
- Population size and density: Electricity generation is the second largest source of harmful emissions. With more people needing electric power for their homes and businesses, states with large populations emit more harmful gases.
- The climate in the area: Heating and cooling require electric power. Again, because generating electricity typically involves the use of carbon-emitting fuel, states that experience extremes of hot and cold temperatures will inevitably produce larger amounts of harmful emissions.
Initiatives That The US Is Taking To Reduce Carbon Footprint

Given the detrimental effects of global warming, the U.S., being a world leader, needs to address the issue powerfully. Fortunately, the country’s leaders have come together to forge initiatives that will reduce greenhouse gas emissions and slow down the upward surge of the planet’s temperature.
In 2017, governors of 25 states joined hands to support the Paris Agreement on climate change. Called the U.S. Climate Alliance, this coalition of states committed to upholding the objectives of the international agreement in their respective jurisdiction by reducing the country’s CO2 emissions by 26-28 percent based on 2005 levels by 2025.
The alliance represents 55% of the U.S. population and 40% of GHG emissions in the country. With an economy of $11 trillion, the U.S. Climate Alliance will only be behind the United States and China in terms of the economy if it were a country.
The following are the initiatives they’ve been taking to reduce their carbon footprints.
#1 Implemented policies that will significantly reduce emissions of harmful gases
All member states are committed to reducing discharges of greenhouse gases by 26-28 percent by 2035, as based on 2005 levels. However, other states are striving for further reductions.
For example, California not only aims to decrease GHG emissions by 26-28 percent but also plans to rely on 100% carbon emissions-free electricity by 2045. Meanwhile, New Mexico intends to lower the state’s discharges of GHG by 40% based on 2005 levels by 2030.
#2 Promoted regulations to slash air pollutants
Although CO2 is the most notorious among the GHG that impacts air quality, other pollutants like methane and hydrofluorocarbons (HFCs) also put the climate at risk. That’s why several states pushed to limit the emissions of such gases. New York, Maryland, and Connecticut, as well as Washington DC and Vermont, have regulations in place that ban the use of HFCs.
#3 Fast-tracked policies for zero-emission vehicles
Passenger vehicles are the largest source of harmful emissions in the transport sector. Colorado and Hawaii addressed this problem by implementing policies that promote the use of electric vehicles.
#4 Pushed for improvements in energy efficiency
Residential and commercial buildings consume 40% of the country’s generated power. With electricity generation being the second largest contributor of CO2 emissions, pushing for energy efficiency is a crucial part of mitigating climate change. Washington DC Governor Jay Inslee signed the Clean Buildings Act that establishes a standard to improve the energy performance of large commercial buildings in the state.
#5 Signed legislation that promotes renewable energy
Using clean energy is critical in lowering pollution. That’s why states belonging to the Climate Alliance sought to give more priority to renewable energy sources when it comes to powering their needs. Nevada aims to increase the amount of electricity the state gets from renewable sources to 50% by 2030. In the meantime, Minnesota seeks to rely on 100% clean energy in the state’s electricity sector by 2050.
#6 Created tools and resources that helps fight climate change
Special tools and resources that track the risks and impacts of climate change, as well as the progress made in combating the problem, will go a long way in helping address the issue.
North Carolina has made available the Greenhouse Gas Inventory that contains the details of the number of harmful emissions coming from present and future projects. The state also created a website devoted to Coastal Adaptation and Resiliency to aid the state’s coastal communities in mitigating the effects of climate change in their area, such as the rising sea levels.
#7 Provided funding options for clean energy and resilient communities
Massachusetts Governor Charlie Baker signed legislation authorizing over $2.4 billion in investments to protect the state’s residents, municipalities, and companies from the effects of climate change. The law also aims to safeguard environmental resources and improve recreational opportunities.
In addition, Colorado has established a new Green Bank that will harness private-sector money to promote investment in clean-energy initiatives.
FAQs
What areas are most affected by carbon emissions?
Based on the Global Climate Risk Index, the top 5 countries that are now experiencing the adverse effects of increased carbon emissions: Japan, the Philippines, Germany, Madagascar, and India.
Within the U.S., these 5 cities face the greatest risk from global warming: New Orleans, New York, Phoenix, Los Angeles, and Miami.
What is the biggest contributor to global warming?
Greenhouse gases trap the sun’s radiant heat in the atmosphere, thus driving up the planet’s temperature in a process called global warming. As the amount of these gases increases, so does the heat that remains locked near the earth’s surface. So we can say that the emission of greenhouse gases is the most significant contributor to global warming.
But what’s causing these emissions? Human activities, that’s what. And among these human activities, the combustion of traditional energy sources for electricity generation, heat, and transportation causes the majority of the GHG that warm the planet.
Who Is The Biggest Polluter In The World?
The emissions come from all over the globe, but certain countries have ejected more of the harmful gases than others.
The top 10 polluters and the amount of CO2 they emitted are China: (10,065 million tons), United States (5,416 million tons), India: (2,654 million tons), (Russia: 1,711 million tons), Japan: (1,162 million tons), Germany: (759 million tons), Iran: (720 million tons), South Korea: (659 million tons), Saudi Arabia: (621 million tons) and Indonesia: (615 million tons).
Is The US Doing Enough To Reduce CO2 Emissions?
Emissions of CO2, as well as other harmful gases, are falling. The rapid growth of renewable energy sources is one of the reasons why. Still, as a significant portion of the country’s population is starting to recognize climate change’s impacts, there is a growing clamor for the national government to address the problem with more vigor.
Strong support for policies to lower carbon output exists, which should serve as an impetus for the country’s leaders to put more effort into curbing the release of gases that impact the environment and the planet.
Final Words
The Covid-19 pandemic, which resulted in the slowdown of the world’s economy, temporarily dampened the surging carbon emissions in different parts of the globe, including the U.S. Still, the threat of climate change remains, and it’s likely to escalate as various sectors that eject CO2 into the atmosphere go into full gear once more.
The best way to hold back, if not completely halt global warming, which is the driving force behind climate change, is to reduce the emissions of harmful gases into the atmosphere. The U.S. has done its share in bringing down its emissions. However, much remains to be done.
State policies play a big role in lowering the levels of GHG that go into the air. Policies that put a cap on carbon emissions by states and put forth incentives for the use of clean energy will give the fight against climate change a significant boost.
Still, saving the country and the rest of the planet from the destructive consequences of climate change will require the full cooperation of everyone. This means that all states and countries need to reduce their emissions of harmful gases significantly.
If the U.S. manages to depend entirely on clean energy to power its needs, that will be a monumental achievement and will serve as a beacon to other nations who share the same vision and mission. Of course, it will take tons of work and a lot of determination. But the results will be well worth it as it will be equivalent to pushing the slow-motion button on global warming.
Updated on